Infographics have become one of the most effective ways to explain ideas quickly. Whether you’re a student, content creator, or someone preparing a presentation, learning the basics of creating infographics can make your information easier to understand and far more engaging. You don’t need to be a designer to do it well, just a little structure, planning, and creativity.
This guide walks you through the process in a clear and friendly way so you can confidently turn complex information into meaningful visuals.
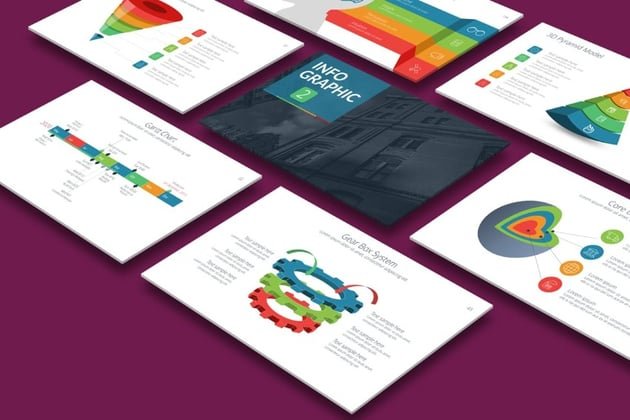
What Is an Infographic?
An infographic is a visual format used to present information in a simple and easy-to-read way. It blends text, icons, charts, illustrations, and layout design to help people understand a topic quickly. Instead of reading long paragraphs, a viewer can look at an infographic and grasp the main points instantly.
Why Infographics Matter
Infographics are helpful because they simplify complex information. They catch attention faster than plain text, and people tend to remember visuals more clearly than long explanations. They’re also highly shareable, which makes them useful for educational content, reports, and online posts.
Different Types of Infographics
Each type of infographic serves a different purpose. Knowing which one fits your topic makes the design process smoother.
Statistical Infographics
Great for survey results, data comparisons, and research summaries.
Timeline Infographics
Useful when explaining historical events, career growth, or step-by-step developments over time.
Process Infographics
Ideal for workflows, instructions, and tutorials with clear steps.
Comparison Infographics
Helpful when comparing options, features, or pros and cons side-by-side.
Informational Infographics
A clean way to break down concepts using short text sections and icons.
Hierarchical Infographics
Perfect for ranking information based on levels or importance.
Map Infographics
Designed for geographic information, demographic data, or location-based topics.
How to Create an Infographic Step by Step
Follow these steps to design your own infographic in a simple, structured way.
Step 1: Identify Your Purpose and Audience
Start by understanding what you want to communicate and who will read it. When your purpose is clear, your design choices become easier and more focused.
Step 2: Collect and Organize Your Information
Gather reliable data or content. Then break it into small, clear sections. Remove anything that feels unnecessary or overly detailed. Infographics work best when information is simple and easy to skim.
Step 3: Choose the Most Suitable Infographic Type
Match your content to one of the infographic types above. For example, use a comparison layout if you’re showing differences or a process layout if your content follows steps. Choosing the right type gives your design a natural flow.
Step 4: Create a Rough Structure
Sketch a basic outline to plan where titles, sections, icons, and visuals will go. This helps you maintain a clean, logical layout before adding design elements.
Step 5: Pick a Simple Color Scheme
Choose a minimal and consistent color palette. A balanced combination of one main color, one supporting color, and a neutral background often looks professional and easy on the eyes.
Step 6: Select Clear and Readable Fonts
Use one font for headings and one for body text. Readability matters more than decoration. Clean fonts keep your infographic neat and accessible across devices.
Step 7: Add Appropriate Visual Elements
Icons, illustrations, and charts bring your information to life. Use them intentionally. Every visual should support the message instead of crowding the design. Leave enough white space so the infographic doesn’t feel overloaded.
Step 8: Use Strong Visual Hierarchy
Give more importance to key headings, numbers, or sections by adjusting size or placement. Good hierarchy guides the viewer’s eyes from start to finish without confusion.
Step 9: Keep the Text Short and Direct
Infographics are meant to highlight information, not overwhelm readers. Use brief lines, quick explanations, and small text blocks. Clarity is the goal.
Step 10: Review and Make Final Adjustments
Look over your design for spacing, alignment, accuracy, and readability. Small improvements, slightly increasing spacing or adjusting a heading, can make a big difference in the final look.
Tips for a Standout Infographic
Leave enough space between elements for a clean feel.
Use contrast to show importance.
Keep your visual style consistent throughout the design.
Present information in a logical flow from top to bottom.
Make sure every element has a purpose.
Common Mistakes to Avoid
Too much text in one place
Overcrowded layouts
Using too many colors
Mixing different icon styles
Fonts that are too small
A message that feels scattered or unclear
A simple, balanced design is usually the most effective.
Final Thoughts
Creating a good infographic doesn’t require advanced design skills. With clear goals, organized information, and a thoughtful structure, anyone can create visuals that communicate ideas in an engaging way. Infographics help people understand and remember information faster, making them useful in classrooms, workplaces, blogs, and social media.